Summary of Benefits
This Summary of Benefits is provided to inform you that as a member of a Participating Identity Protection Membership Program, that includes identity theft insurance wherein you are entitled to benefits under the Policy as issued to ConsumerInfo.com or CSIdentity Corporation and described in this Summary of Benefits. Various provisions in this Summary of Benefits and in the Policy restrict coverage. Read the entire Summary of Benefits carefully to determine rights, duties and what is and is not covered.
This Summary of Benefits does not state all the terms, conditions, exclusions and definitions within the Policy. Your benefits will be subject to all the terms, conditions, exclusions and definitions of the Policy as issued to ConsumerInfo.com, CSIdentity Corporation or as a Participating Identity Protection Program provider extended coverage under the Policy. A complete copy of the Policy will be available upon request. If the Policy is terminated, your benefits under the Policy will cease effective that date. It is the obligation of your Participating Identity Protection Membership Program provider to inform you of any termination of the Policy.
The Identity Fraud Expense Reimbursement benefit is underwritten and administered by American Bankers Insurance Company of Florida, an Assurant company, under a group or blanket policy issued to ConsumerInfo.com, Inc. or CSIdentity Corporation, both Experian companies and also known collectively as Experian Consumer Services (hereinafter, “Experian”), or its respective affiliates for the benefit of its Members. To obtain a complete copy of the Policy contact the customer assistance center contained in your membership materials. . American Bankers Insurance Company of Florida administers all claims and is solely responsible to Members with respect to the Identity Fraud Expense Reimbursement benefit.
All references to We, Us, and Our throughout this Summary of Benefit means American Bankers Insurance Company of Florida.
LIMITS OF INSURANCE
Please see your participating identity protection membership program fulfillment materials for your coverage limit per 12 Month Period
| Coverage |
Limit of Liability |
| Expense Reimbursement |
Please see your participating identity protection membership program fulfillment materials for your coverage limit per 12 Month Period |
| Cash Recovery (Cash Recovery only applicable if included in the participating identity protection membership program) |
Please see your participating identity protection membership program fulfillment material for your Cash Recovery limit. Cash Recovery is not included in all identity theft plans |
DUTIES WHEN LOSS OCCURS
Upon knowledge or discovery of loss or of an occurrence which may give rise to a claim under the terms of this coverage, the policyholder is responsible for notifying the member of the following requirements:
a. Give notice as soon as practicable to:
(1) the appropriate authority and affected institutions, if applicable; and
(2) call the customer assistance number contained in your membership materials to make a valid claim within sixty (60) days of the date of discovery, or as soon as reasonably possible.
If the loss involves a violation of law, the member shall also notify the police. The member must submit a copy of the police report when filing a claim;
For Cash Recovery, the member must provide documentation from the financial institution that the funds were fraudulently removed and are non-recoverable from the financial institution.
b. File detailed proof of loss, duly sworn to, with us within sixty (60) days after the discovery of loss;
c. Take all reasonable steps to mitigate loss resulting from identity fraud including, but not limited to, requesting a waiver for any applicable fees, loan application fees or credit bureau fees;
d. Upon our request, submit to examination by us, and subscribe the same, under oath if required;
e. Upon our request, cooperate to help us enforce legal rights against anyone who may be liable to the member to include giving evidence and attending depositions, hearing and trials;
f. Immediately forward to us any notices, summons or legal papers received by the member in connection with the loss or the identity fraud;
g. Produce for our examination all pertinent records;
h. Cooperate with us in all matters pertaining to loss or claims; all at such reasonable times and places as we shall designate.
The member shall not voluntarily assume or admit any liability, nor, except at said member’s own cost, voluntarily make any payment or incur any expense without our prior written consent, such consent not to be unreasonably withheld.
The member shall keep books, receipts, bills and other records in such manner that we can accurately determine the amount of any loss. At any time, subsequent to the reporting of the loss to us, we may examine and audit the member’s books and records as they relate to a loss under the Policy.
COVERAGE
Identity Fraud – Expense Reimbursement
We will reimburse the member for expenses and legal costs incurred by the member, up to the Aggregate Limit of Liability as shown on the Limits of Insurance section of their participating identity protection membership program fulfillment materials from the direct result of the following:
- Fraud or Embezzlement
For loss arising out of fraud or embezzlement perpetrated against the member, with an occurrence date during the term of the membership.
- Theft
For loss resulting directly from theft of property related to the member’s information, checkbook, savings record, ATM access or securities from the member, with an occurrence date during the term of the membership, by a person from whom the member purchased goods or services.
- Forgery
For loss, with an occurrence date during the term of the membership, resulting directly from forgery or alteration of checks, drafts, promissory notes, or similar written promises, orders or directions to pay money that are:
a. Made or drawn by or drawn upon the member’s account; or
b. Made or drawn by one purporting to act as the member’s
- Data Breach
For loss, with an occurrence date during the term of the membership, resulting directly from the misuse of the member’s information as a result of a data compromise of information from a financial institution, a credit reporting agency, a credit grantor, a securities firm, employer or other institution/company maintaining the member’s personal information, that results in monies stolen from the member’s accounts or misuse of data to obtain property, credit or monies using the member’s information.
- Stolen Identity Event
For loss resulting from a stolen identity event, including but not limited to a stolen identity event occurring on or arising out of the use of the Internet. The occurrence date must be during the term of the membership. A stolen identity event means the theft, unauthorized, or illegal use of the member’s name, social security number, or other method of identifying the member.
Cash Recovery
We will reimburse the member, up to the Limit of Liability as shown on the Limits of Insurance section of the member’s identity protection membership program fulfillment materials when this benefit has been included, a Cash Recovery benefit limited to payment for one (1) occurrence within any twelve (12) consecutive months of the term of the membership, for recovery of traditional credit cards, pre-paid credit cards and debit card deductibles or in the event of an unauthorized electronic fund transfer, reimbursement for unrecoverable funds, exclusive of interest, directly drawn from or removed through an unauthorized electronic fund transfer from the member’s mobile device (smart phone) or other financial account due to an act of fraud, embezzlement, theft, forgery or other data breach which have not been recovered.
Cash Recovery does not cover unrecoverable funds for which the member did not seek reimbursement from the financial institution, or other provider which issued the access device and holds the account from which funds were stolen, and for which the member has not received reimbursement from any other source.
The member will only be covered from an unauthorized removal of funds or an unauthorized electronic fund transfer if the loss first occurs on or after the effective date of the Policy under which this coverage is provided, while the member is an active and paid member of the policyholder, and the loss is reported to us within ninety (90) days of discovery.
The member is not covered if the unauthorized removal of funds or unauthorized electronic fund transfer first occurs after the termination of the Policy under which this coverage is provided, or the member is not an active member of the participating identity protection membership program.
For Family Plans, the Cash Recovery benefit is limited to payment for one (1) occurrence within twelve (12) consecutive months, not to exceed the Limit of Liability as shown on the Limits of Insurance section of the member’s participating identity protection membership program fulfillment materials, when this benefit has been included.
The Cash Recovery benefit when included in member’s identity protection membership program is part of, and not in addition to the Expense Reimbursement Limit of Liability. We will pay up to the Limit of Liability as shown on the Cash Recovery Limits of Insurance section of member’s participating identity protection membership program.
For Cash Recovery, account means a cash, credit card, demand deposit (checking), savings, or money market account of the member, held directly or indirectly by a financial institution and established primary for personal, family or household purposes.
EXCLUSIONS
Expense Reimbursement and the Cash Recovery do not cover:
a. loss due to any fraudulent, dishonest or criminal act by the member or any person acting in concert with the member, or immediate family member, whether acting alone or in collusion with others;
b.loss resulting directly or indirectly from any errors or omissions occurring in the following actions:
(1.) the input of data to any computer system; or
(2.) the processing of data by any computer system; or
(3.) the manual or electronic processing of any output produced by any computer system;
b. loss resulting directly or indirectly from the voluntary surrendering by the member of any access device, in whole or in part, to any person or entity;
c. loss resulting from any unintentional clerical error in the transfer from or debit of any account of the member which is initiated by a financial institution, or any employee(s) thereof. However, this exclusion shall not apply to a fraudulent act of an employee(s) of a financial institution where said employee(s) is acting without the permission or instruction of their employer;
d. loss in connection with any pre-authorized transfer from any account to or for the benefit of a financial institution, or to any other account of the member;
e. indirect or consequential loss of any nature;
f. loss of potential income not realized by the member;
g. loss resulting from an identity fraud that was discovered prior to the effective date of the Policy under which this coverage is provided;
h. loss arising out of business pursuits of the member;
i. loss of valuable papers, valuable documents, jewelry, silverware and other personal property including the philatelic value of stamps and the numismatic value of coins not in circulation;
j. property damage, bodily injury or personal injury;
k.losses incurred from financial performance of any investment of financial product;
l.loss from games of chance;
m.for Cash Recovery losses other than traditional credit cards, pre-paid credit cards and debit card deductibles or unrecoverable funds, exclusive of interest, directly drawn from or removed through an unauthorized electronic fund transfer from the member’s mobile device (smart phone), or other financial account.. All other monetary devices are excluded;
n. any loss, claims or damages that are not covered under the terms and provisions of the Policy under which this coverage is provided;
o.legal fees in excess of $125 per hour;
p.any loss which occurred while the member was not an active member of the participating identity protection membership program
DEFINITIONS
Access Device means a card (including credit, debit and ATM cards), code, PIN, password, personal check or other similar means of access to the member’s account at a financial institution that may be used by the member to gain access to said account for the purpose of withdrawing or transferring funds, making purchases, or making long distance or cellular/digital (wireless) telephone calls.
Data Breach means the misuse of the member’s information as a result of a data compromise of information from a financial institution, a credit reporting agency, a credit grantor, a securities firm, employer or other institution/company maintaining the member’s personal information, that results in monies stolen from the member’s accounts or misuse of data to obtain credit or monies using the member’s information.
Date of Discovery occurs when the member first becomes aware of facts which would cause a reasonable person to assume that a loss covered by this insurance has been or will be incurred, even though the exact amount or details of loss may not then be known. Discovery also occurs when the member receives notice of an actual or potential claim against the member involving loss covered under this insurance.
Domestic Partner means a person designated in writing by the primary member who is registered as a domestic partner or legal equivalent under laws of the governing jurisdiction or who:
- is at least 18 years of age and competent to enter into a contract;
- is not related to the primary member by blood;
- has exclusively lived with the primary member for at least twelve (12) consecutive months prior to the effective date of coverage;
- is not legally married or separated; and
- as of the date of coverage, has with the primary member at least two (2) of the following financial arrangements:
a. a joint mortgage or lease;
b. a joint bank account;
c. joint title or ownership of a home, motor vehicle or status as joint lessee on a motor vehicle lease;
d. a joint credit card account with a financial institution.
Expenses mean:
- Costs incurred by the member for re-filing applications for loans, grants, or other credit that are rejected solely because the lender received from any source incorrect information as a result of the identity fraud;
- Costs for notarizing affidavits or other similar documents, long distance telephone calls, travel and postage reasonably incurred as a result of the member’s efforts to report an identity fraud or amend or rectify records as to the member’s true name or identity as a result of an identity fraud;
- Reasonable costs incurred by the member for up to six (6) credit reports from established credit bureaus (with no more than two (2) reports from any one credit bureau) dated within twelve (12) months after the member’s discovery of an identity fraud, and costs incurred for contesting the accuracy or completeness of any information contained in a credit report following an identity fraud;
- Payment for reasonable expenses incurred for the placement of up to twelve (12) credit freezes or credit thaws per 12 month period as a result of being notified of a data breach in which the member’s personal information was compromised and payment for expenses that were a result of recovery from an identity fraud such as; credit freeze, credit thaw costs, transcript costs, appeal bond, court filing fees, expert witness or courier fees;
- Actual lost base wages that would have been earned, for time reasonably and necessarily taken off work solely as a result of efforts to amend or rectify records as to the member’s true name or identity as a result of an identity fraud. Actual lost wages includes remuneration for vacation days, discretionary days, floating holidays, and paid personal days and excludes sick days, business interruption and future earnings of a self-employed professional. Coverage is limited to base wages within twelve (12) months after discovery of an identity fraud. Base wages must be supported by and based on the prior year tax return.
- Child or elderly care costs that would have otherwise not been incurred, resulting from time reasonably and necessarily taken away from providing such care as a result of efforts to amend or rectify records as to the member’s identity as a result of an identity fraud.
- Reasonable and necessary costs incurred by the member for ordering medical records for the purpose of amending and/or rectifying these documents as a result of an identity fraud.
- Reasonable and necessary costs incurred by member for the replacement of identification cards, driver licenses and passports as a result of an identity fraud.
- Reasonable and necessary costs, up to a maximum of $125 per hour, incurred by the member for use of any investigative agency or private investigator engaged to amend or rectify records as to the member’s true name or identity as a result of an identity fraud. We reserve the right to select such investigative agency or private investigator; however, with our express prior written consent, member may elect such investigative agency or private investigator.
- Reasonable and necessary costs, up to a maximum of $125 per hour, incurred by the member associated with the use of any certified public accountant engaged to amend or rectify records as to the member’s true name or identity as a result of an identity fraud. We reserve the right to select such certified public accountant; however, with our express prior written consent, member may elect such certified public accountant.
Family Member means the primary member’s spouse or domestic partner, parent, siblings, children and/or any other member of, or dependent persons residing in the primary member’s household. Family member also includes a primary member’s spouse or domestic partner’s:
- unmarried children (including those who the member is their legal guardian) under twenty-one (21) years of age.
- unmarried children (including those who the member is a legal guardian) under twenty-six (26) years of age if a full-time student at an accredited college or university.
- dependent(s) with documented disabilities who have the same primary residence as the member and who relies on the member for maintenance and support.
Any family member who does not reside at the primary member’s home is not eligible for coverage, except unmarried children (including those who the member is a legal guardian) under twenty-six (26) years of age if a full-time student at an accredited college or university.
Family Plan means a membership program that: extends coverage, up to the Aggregate Limit of Liability as shown on the Limits of Insurance section of your participating identity protection membership program, to the primary member and their family members and for which the Family Plan membership fee/product fee is paid.
The Aggregate Limit of Liability shown on the Limits of Insurance section of your participating identity protection membership program will be the maximum amount we will pay for all covered losses per Family Plan regardless of the number of losses that occur for any one member per twelve (12) month period.
Forgery means the signing of the name of another person or organization with intent to deceive. It does not mean a signature, which consists in whole or in part of one’s own name signed, in any capacity, for any purpose.
Fraud or Embezzlement includes electronic, telegraphic cable, teletype tele facsimile, telephone or written instructions which: purports to have been transmitted or written by the member, but which was in fact fraudulently transmitted or altered by someone else without member’s knowledge or consent; or received by the member which purports to have been transmitted by an employee but which was in fact fraudulently transmitted by someone else without member’s or employee’s knowledge or consent.
Identity Fraud means the act of knowingly transferring or using, without lawful authority, a means of identification of the member with the intent to commit, or to aid or abet, any unlawful activity that constitutes a violation of Federal, State or local law.
Legal Costs means costs, up to a maximum of $125 per hour, for reasonable fees for an attorney fees for an attorney selected by the member and related court fees, incurred by the member with our consent, for:
- Defense of any legal action brought against the member by a merchant, creditor or collection agency or entity acting on their behalf for non-payment of goods or services or default on a loan as a result of the identity fraud;
- Defense of or the removal of any civil judgments wrongly entered against the member as a result of identity fraud; and
- Challenging the accuracy or completeness of any information in a member’s consumer credit report, medical history or tax history, as a result of identity fraud; and
- Member’s initial consultation with a lawyer to determine the severity of and appropriate response to an identity fraud.
Loss means the expenses and legal costs incurred by the member as the direct result of a covered transaction.
Member means the primary member and primary member’s family member if the primary member is enrolled in or elects a Family Plan membership program.
Occurrence means an incident of an actual or attempted fraudulent, dishonest or criminal act or series of related acts, whether committed by one or more persons.
Occurrence Date means the earliest possible date of discovery.
Participating Identity Protection Membership Program means an identity protection membership program for which coverage has been extended to under a group or blanket policy issued to ConsumerInfo.com, Inc. or CSIdentity Corporation, both Experian companies and also known collectively as Experian Consumer Services (hereinafter, “Experian”), or its respective affiliates, and for which coverage has been paid by Experian.
Policyholder means ConsumerInfo.com, Inc. or CSIdentity Corporation, both Experian companies and also known collectively as Experian Consumer Services (hereinafter, “Experian”), or its respective affiliates.
Primary Member means a customer who is enrolled in a Participating identity protection membership program that includes identity theft insurance who is in good standing:
- for which the primary member membership fee/ product fee has been paid; and
- whose name is shown on the membership.
Proof of Loss means receipts for reasonable out of pocket expenses.
Spouse means a person who is either:
- legally married to the primary member; or
- meets the definition of domestic partner to the primary member.
Stolen Identity Event means the unauthorized, or illegal use of the member’s name, social security number, or other method of identifying the member.
Unauthorized Electronic Fund Transfer (UEFT) means an electronic fund transfer from the member’s account, initiated by a person other than the member without the actual authority to initiate such transfer and from which the member receives no benefit.
An unauthorized electronic fund transfer does not include an electronic fund transfer initiated:
- by a person who was furnished the access device to the member’s account, unless the member had given prior notification to the financial institution that transfers by such person(s) are no longer authorized;
- with fraudulent intent by the member or any person acting in concert with the member;
- by the financial institution or its employees; or
- from any business or commercial account.
CONDITIONS
- Limits of Insurance – Our maximum limit of liability for loss under these Terms and Conditions shall not exceed the applicable limit stated on your participating identity protection membership program.
All loss incidental to an actual or attempted fraudulent, dishonest or criminal act or series of related acts, whether committed by one or more persons, shall be deemed to arise out of one occurrence.
Our total aggregate limit of liability shown on your participating identity protection membership program, or the Policy if in conflict, will be the maximum amount we will pay for all covered losses per primary member or family plan membership, regardless of the number of losses that occur for any one member per twelve (12) month period.
- Loss Payment
We will pay any loss covered under the Policy under which this coverage is provided, within thirty (30) days after:
a. We reach agreement with the member; or
b. The entry of final judgment.
-
- Notice of Claim must be given to us by the member:
a. in writing; and
b. within a reasonable time period after the date of discovery.
- Settlement of Claims
We will pay all covered claims within ninety (90) days from the date we receive acceptable proof of loss at our office.
- Transfer of Rights of Recovery Against Others to Us – If any person or organization to or for whom we make payment under this insurance has rights to recover damages from another, those rights are transferred to That person or organization must do everything necessary to secure our rights and must do nothing to impair them.
Recovery against persons or organizations also insured under this Policy or any other Policy issued by us with respect to the same loss is prohibited.
- Other Insurance – This insurance is excess in the event coverage is provided under any other policy/certificate.
Should member be enrolled in more than one membership program insured by us, we will reimburse the member under each membership:
a. subject to the applicable deductibles and limits of liability of each membership;
b. but in no event shall the total amount reimbursed under all memberships exceed the actual amount of loss; and
c. in no event shall the limit of liability under all memberships exceed the largest limit of liability available to the member under any membership program insured by us.
- Action Against Us – No action may be brought against us unless there has been full compliance with all of the terms and conditions of this Summary of Benefits and suit is filed within twenty-four (24) months from the date of occurrence. No one will have the right to join us as a party to any against the policyholder or member.


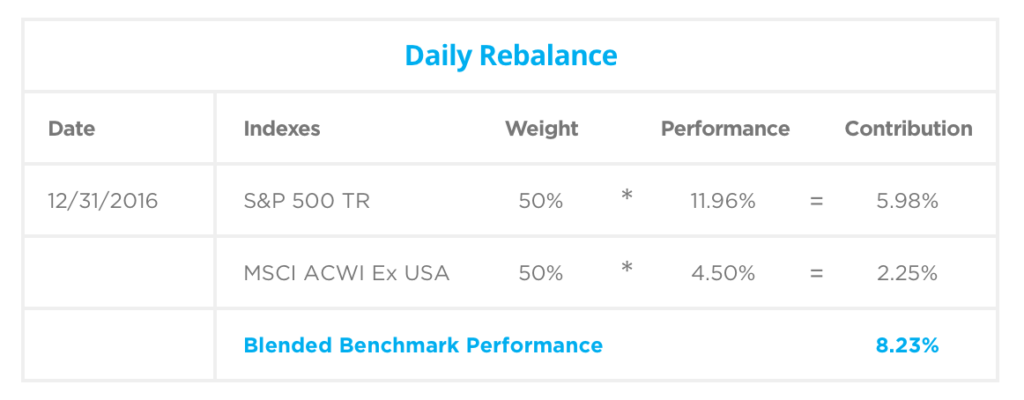 There is a difference of 1.21% (8.23% – 7.02%) between the blend that uses TR and the blend that uses PR for 2016.
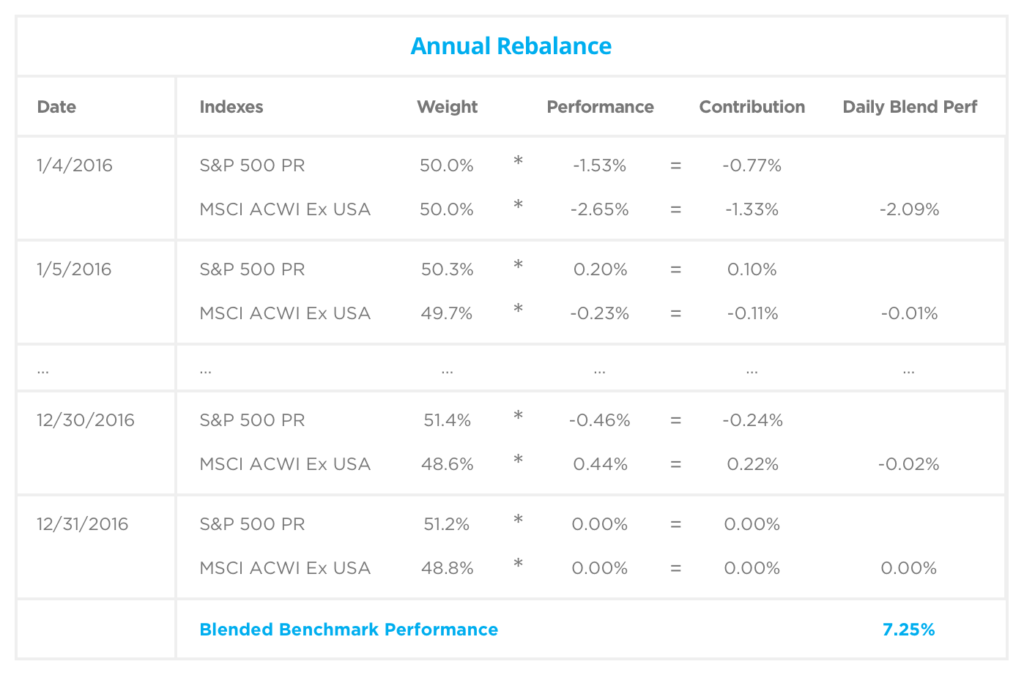
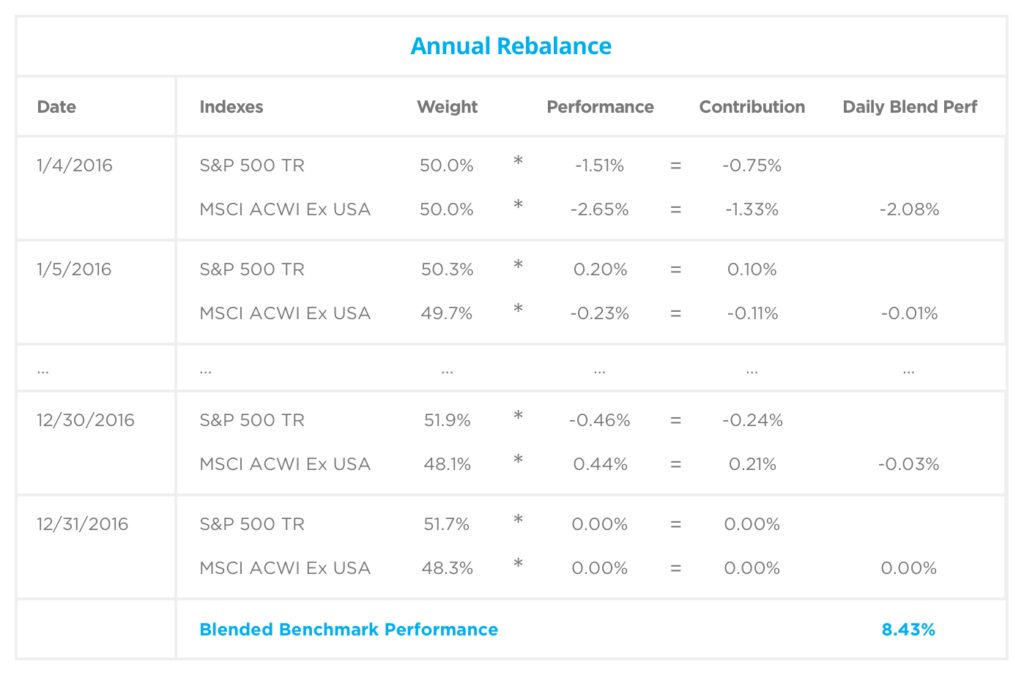 * Start date of 1/4/16 was used, because that was the first day the market was open in 2016