
Creating customized portfolios for clients is a critical and valuable service many advisors offer to their clients, but the mounting needs to personalize portfolios also puts a time pinch on advisors and portfolio managers.
Personalizing a portfolio for a client for tax harvesting, social concerns, and other considerations is a process that can take hours per account. In our busy world, spending a few hours on a single account is not an option and for many advisory firms with a large roster of clients, it’s not even feasible.
We’re introducing ASTRO (Advisor Strategy & Tax Return Optimization) today to take those hours that can be spent optimizing a portfolio and turn them into minutes. ASTRO is a new tool that helps you build tax-efficient SMA portfolios that can also take into account environmental, societal, and governmental (ESG) concerns of your clients. This tool is available to advisors using the Eclipse™ trading and rebalancing platform and TOM (Trade Order Management).
Let’s take a look at what ASTRO can help you do.
Who is ASTRO For?
The full version of ASTRO is built for CFA type users. In this full version of the tool, all the customization and personalization options are accessible and available.
We’re also developing an express version of ASTRO that will be geared to reps and advisors. The express version will assist those types of personnel who are talking to clients and bringing investors in for meetings in the office. The express version is simpler and features a more visual user interface to allow advisors to use it as a tool to show clients how optimizing their portfolio based on models or benchmarks will benefit them.
What does ASTRO Do?
The full and express versions of ASTRO will both help you optimize portfolios. Tax-aware features are one of the biggest advantages to using this new tool.
Here’s a simple example of how the tool helps you with tax planning. Using ASTRO, you will be able to see the amount of capital gains/losses, long-term and short term gains/losses in a client portfolio. ASTRO then does the calculations to figure out how much to sell and buy of each fund to get the maximum return for lowest risk while taking into account capital gains. Additionally, ASTRO is still taking into account the model the portfolio is being compared to to ensure it stays in line with the parameters you’ve set up.
ASTRO also gives you an easy way to deal with legacy holdings. In the past, you might have considered those assets that a client doesn’t want to sell to be a pesky thorn in your paw. But with ASTRO, you you can designate and mark assets that need to be kept, and the system will fit other holdings around it to make sure that your model portfolio still balances out.
The full version of ASTRO, designated for CFA type users, offers advanced tools over the Express version that will be more useful to financial advisors. The full version allows you to import alpha scores to a securities, create buy lists, create fully customizable portfolio configurations with advanced settings, and set your own sector and industry mappings. The full version will also have more advanced reporting features that drill down further into the securities.
How to Get Started with ASTRO
ASTRO will launch for all Orion advisors who trade through Orion Eclipse™ and TOM this Spring. If you’re also a Communities user, you’ll be able to seamlessly pull in any models you subscribe to in Communities to ASTRO as well.
We’ll be providing more information about ASTRO as the spring release date approaches. Make sure to subscribe to the Orion blog to be the first to get news on new product updates.
This blog is the second part of our Compounding Returns series. You can check out Part 1 here.
Have you ever wondered why the gross-of-fee return (GOF) minus the annual fee percent doesn’t equal net-of-fee (NOF) return? The simple answer is compounding. Let’s take a look at some examples to show how compounding can cause a difference between GOF’s and NOF’s.
The first example we will look at will have monthly returns of 0% and an annual fee of 2%.

The difference between GOF and NOF is 1.98%. This is lower than the 2% fee, because the value of the portfolio is going down due to fees being taken out each month. Therefore, it appears that the client didn’t pay 2% in fees, but instead only 1.98%.
If we take the monthly average value of $99,088 and multiple that by 1.98% we get $1,964. This is less than the actual fee amount the portfolio paid. When multiplying the monthly average by 2% we end up with $1,982, which is the same amount the portfolio paid showing that the portfolio did pay 2% worth of fees.
Now let’s look at and example that has a monthly return of 1% with the same annual fee of 2%.

Monthly Average Balance = $104,713
2.21% fee difference * $104,713 = $2,315
2% Fee * $104,713 = $2,094
The final example is to show that the higher the return the bigger the difference will be between GOF’s and NOF’s. This time we will use a 5% monthly return with the same 2% annual fee.

Monthly Average Balance = $131,370
3.39% fee difference * $131,370 = $4,445
2% Fee * $131,370 = $2,627
As we can see, the closer that the period return is to zero the more in sync the annual fee percent will be to the difference of the gross and net returns.
The farther the return is from zero, the bigger the difference the annual fee percent will be to the difference of the gross and net returns. The reason for this fluctuation is because higher returns will compound quicker.
Even though the GOF and NOF difference isn’t the same as the annual fee amount, the portfolio is truly paying the annual fee amount that it was assigned to pay.
If you have any questions about the content covered in today’s article, please contact our SME Performance Team via the online chat in your Orion Social app.
My teenage son has really gotten into lifting weights this year. It’s brought up memories of when I used to lift weights every day in high school and then check myself out in the mirror to see if my muscles were getting bigger. Now I look in the mirror and notice how it didn’t take long for those muscles to shift.

Weight lifting is similar to portfolio returns. You can see gains over time, but it’s easy to see those gains disappear with little effort. We can see how this is done with compounding returns.
What are Compounding Returns?
Compounding returns will show how the investment has benefited from previous period gains/losses. The period returns are geometrically linked together (multiplied) to show how an investment has grown over time.
A compounded return is similar to compounded interest in a savings account. The first month you open a savings account, you get interest on your deposit. The next month, you not only get interest on the original deposit, but interest on the interest.
For investments, compounding has a similar effect, but the investment may experience negative returns as well as positive.
Here’s How it Works
Now that we have defined what compounding returns are, let’s analyze an example with two monthly period returns.
 There is a lot happening in the example above. The portfolio started with $10,000 and during the first period the portfolio went up +25%, which increased the portfolio value by +$2,500 for a total of $12,500. During the second period the portfolio dropped -20% for a loss of -$2,500 dropping the portfolio value back to $10,000.
If we took the average of the two returns we would end up with +2.5%, which we would then expect a total gain greater than $0. When we geometrically link the two period returns ((1 + +25%) * (1+ -20%) – 1))* we get a total return of 0%, which we would then expect to see a total gain/loss of $0, which is what we do see.
When the portfolio was up +25% it only had to drop -20% to lose all of the gains the portfolio had made. Then when a portfolio starts with a loss it takes a lot more effort to climb out of the hole as we can see in the example below.
 Compounding Returns and Your Portfolio
- You have to geometrically link returns to take into account compounding of previous periods.
- It doesn’t take as big of a negative return to lose your gains.
- It takes more gains to dig out of a hole.
- In up markets, compounding is a powerful force.
Being aware of how easy it is to flip a portfolio upside down will help you take on the right amount of risk that fits your client’s level of comfort. That way you aren’t having to dig yourself out of a hole like I am in my old age – trying to gain back in time that muscle I quickly lost.
If you have any questions about the content covered in today’s article, please contact our SME Performance Team via the online chat in your Orion Social app.
*If periods are annual periods then we would annualize using ^ (1 / # of years) in the formula.
0471-OAS-12/8/2017
How the Risk Dashboard Helps You and Your Clients Understand RiskMark Twain once said “There are three kinds of lies: lies, damned lies, and statistics.”
There are plenty of famous (mostly negative) quotes about statistics. We get it. They get a bad rep because while the data may be concrete, the conclusions are sometimes a matter of perspective. You can manipulate data ranges and formulas, and extrapolate outcomes.
On the other hand, statistics are a great way to look at data and help you understand portfolio performance, that is, if you understand what you’re looking at.
By understanding how statistics can be used within Orion, you can help your clients better understand their portfolio risk and performance. Statistics generally fall into one of three categories: Return (the higher, the better), Risk (the lower, the better), and Return vs. Risk (also, higher is better).
Upside Capture would fall under the return category. For the risk category, you can look at Standard Deviation, R-squared, Beta, or Down Capture.
If you want to view Return vs Risk, then you can view the Sharpe Ratio, Sortino Ratio, or Alpha. The risk statistics can further be broken down into broader categories: volatility and benchmarks (compares the portfolio vs a benchmark).
Standard Deviation, Sharpe Ratio and Sortino Ratio would be considered volatility statistics, while R-squared, Beta, Downside Capture, Upside Capture and Alpha are benchmark statistics. Therefore, what type of risk you want to see will determine which risk statistic to use.
For that reason a Risk Dashboard was created within Insight in order to better help you tell the story of risk for those one on one client presentations.
The new dashboard is found within the performance tiles. If you click on the icon below in any of the performance tiles, a pop out box will open with a Risk Dashboard.

The pop out will include charts, portfolio risk stats as well as benchmark risk stats as seen below to help tell the story.

Let’s take a deep dive into each section, so you can get the most out of the Risk Dashboard.

First, we will start at the top of the page and take a look at the charts. The chart that shows up is the Return vs Standard Deviation chart. There are two other charts you can view by clicking on the blue arrows. They are Return vs Beta and Upside vs Downside. More return vs risk charts will be added in the near future as well as rolling return vs risk charts.
Some neat features included with the charts is the ability to hover over the plot series icon to view the risk stats associated with the portfolio or benchmark. You can also click on the portfolio or benchmark name in the legend to hide or unhide that data point in the chart.

Next let’s take a look at the middle section or the portfolio level.
By clicking on the funnel icon next to the word ‘Selection’ it will pop up a box that will allow you to choose groupings that you can drill down to. For example, you can drill down and view the risk of the accounts, assets, asset categories, and more. This will allow you to show clients where the risk is coming from for the higher levels

Now that the levels have been chosen we will go and look at the settings that can be changed as well. Clicking on the cog/gear icon at the portfolio level will allow you to change the rolling period to one, five or ten-year from the default three-year. Three years or longer is recommended due to the risk statistic calculations using monthly data points. Having more data points will give a more accurate number.

Under the columns option you can hide or unhide risk statistics that are available. One of the risk numbers you will notice is a risk blend number. This risk number was added to give you an idea of how risky each level is. The risk blend number is calculated by summing 33% Standard Deviation, 33% Beta and 34% Downside Capture.

My favorite feature in the Risk Dashboard can be found by clicking the cog icon in the benchmark section. The benchmarks that show up are the default benchmarks assigned to the level that is at the top of the hierarchy. If you don’t want to view those benchmarks then you can change the benchmarks that are shown by adding benchmarks under the ‘select comparisons’ option.
The S&P 500 is not always going to be the best benchmark to compare to. You can choose which benchmark to compare the portfolio to by choosing a market benchmark or blended benchmark. There is also the option to change the risk-free rate as well.

Choosing the right risk statistics to view together will help you tell the story of how you manage risk. It allows you to show your clients the benefit of risk management and what it means for their portfolio.
You can find a list of risk statistics and their definitions in Orion Social by searching for ‘risk statistics’ or reaching out to the Performance Team. If you have any questions about using the Risk Dashboard, please contact the Orion SME Performance Team at performance@orion.flywheelsites.com.
0396-OAS-10/20/2017
How Can I Use Performance Attribution?You may be familiar with the phrase “correlation does not equal causation.” It’s often used in statistics, and is rooted in a logical fallacy, cum hoc ergo propter hoc (translation: “with this, therefore because this”).
Often, it can be difficult to determine the cause of anything, with so many uncontrolled variables. And while correlation certainly does not equal causation, Orion now has a tool that allows you to attribute performance to specific factors.
If you’ve ever looked at your portfolio performance and wondered what contributed to outperforming or underperforming the benchmark, Orion’s Performance Attribution can provide some clarity.
We created a performance macro attribution screen, using the Brinson-Fachler method, to help answer that question. You can access Performance Attribution in the Insight app for questions like “Did I overweight/underweight the right asset category?” or “Did I pick the right stocks?” vs the benchmark.
Where can I view attribution?
On all of the performance tiles, there is a new icon, ![]() . Once clicked, a box will display that has three tabs: “Overview,” “Risk,” and “Attribution.” Today we are just going to focus on the attribution tab. Once you click on “Attribution” the following will appear:
. Once clicked, a box will display that has three tabs: “Overview,” “Risk,” and “Attribution.” Today we are just going to focus on the attribution tab. Once you click on “Attribution” the following will appear:

You can choose the time frame and whether to view the Household, Registration, Account or the Portfolio Group level. Then, you can drill down to the Asset Category to dig deeper. The Asset Category will use the benchmarks assigned to the Asset Category for the comparison.
The bar graph is broken up by months to show you the Allocation, Selection, and Interaction Effects for each month. The Total Effect is a rolling sum of the Allocation, Selection, and Interaction Effects from the Start Date.
What exactly is this telling me?
The Allocation Effect shows whether value was added by overweighting or underweighting the Asset Category vs the benchmark. What does this mean? It means that if the number is positive and you overweight the asset category vs the benchmark, then you made the right choice to overweight the asset category. Same thing goes for if you underweighted the Asset Category vs the benchmark. If the number is positive then you made the right choice to underweight.
The Select Effect shows the value added by selecting different assets than the benchmark holds. If the selection effect is positive, then you made the right choice choosing different assets than the benchmark holds and vice versa for if the Select Effect is negative.
The Interaction Effect shows whether the manager did a superior job by making a good selection and overweighted that selection. Just like the other two effects you want this one to be positive as well. This means if the portfolio weight was greater than the benchmark, and the portfolio return was greater than the benchmark, and the Interaction Effect was positive then the manager did a superior job.
The Total Effect are all three effects summed together (Allocation Effect + Selection Effect + Interaction Effect).
With the bar chart, displaying monthly intervals, and the line graph, displaying the sum of the monthly intervals, the Attribution Dashboard provides insight beyond speculation. This handy tool helps tell the story of how you added value to a client’s portfolio, and why active management is important.
If you have any questions about using the Attribution Dashboard, please contact the Orion SME Performance Team through Orion Social.
0351-OAS-9/25/2017
Are You All Packed for Your GIPS Verification?
What’s your ideal vacation? Do you prefer the solitude of the mountains? Or the bliss of the beach?
We may not agree on where to go, but there is one thing we can agree on: packing is the worst. We just want to get on with the vacation without the hassle of preparation. You’re never sure exactly what you’ll need, you always seem to forget the one thing you swore you packed, and don’t get me started on those pesky TSA regulations.
Packing will always require guesswork, but your GIPS verification shouldn’t. And that thing you forgot to pack? Well, we can’t help you with that, but we can make sure you’ve got all you need with these GIPS verification queries.
Here at Orion we are always enhancing our tools to help our Advisors meet their needs and goals of becoming GIPS compliant. We also realize the importance of being GIPS verified. For that reason, we worked closely with a verification firm to build queries that will help our Advisors get the data they need to send to the verification firm.
The queries will then have all of the necessary information the verification firm needs to complete the verification process.
But before we get to the data queries, a quick refresher…
What is GIPS?
The Global Investment Performance Standards (GIPS) are ethical standards for investment managers, created by the Chartered Financial Analyst Institute. GIPS ensure a full disclosure and representation of investment performance results. Governed by the GIPS Executive Committee, these guidelines establish standards for reporting your firm’s ability to make investor profits—essentially leveling the playing field and ensuring a fair comparison of firms worldwide.
In order to claim GIPS compliance, firms must meet all the requirements, including input data, calculation methodology, composite construction, disclosures and presentation, and reporting.
While Orion itself is not GIPS verified, we do have the reporting capabilities to help your firm easily compile the data you will need to provide during the verification process, with a series of data queries.
GIPS Data Queries
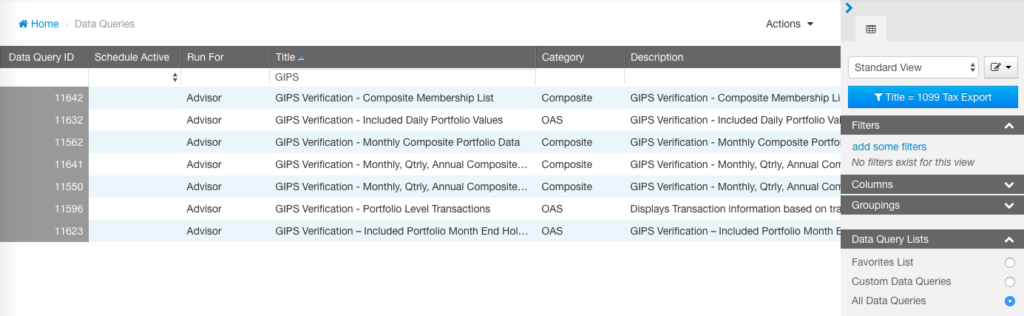
You can find all the data queries listed in this article in your Data Queries app in Orion Connect. Simply check “All Data Queries” in your filter options and then search for them by name.
The queries are listed below and include a description for each:
GIPS Verification – Composite Membership List
- Details when each account was included/excluded from the composite and which management style or model it was in
GIPS Verification – Included Daily Portfolio Values
- Daily values of each included account for the composite month chosen
GIPS Verification – Included Portfolio Month-End Holdings
- Month-end holdings for each included account for the composite month chosen
GIPS Verification – Monthly Composite Portfolio Data
- Monthly Gross/Net of fee performance, as well as beginning and ending values for each month
GIPS Verification – Monthly, Quarterly, Annual Composite Performance by Date (can be run for Management Style or Model)
- Monthly, Quarterly, and Annual composite level performance (Gross and Net)
- Annual dispersion (asset weighted and equal weighted standard deviation)
- Year-end number of accounts and values
GIPS Verification – Portfolio Level Transactions
- Portfolio level transactions (purchases, sales, income, cash flows, expenses, etc.) for every portfolio for the entire time period the portfolio is in the composite
These queries will help cut down on the back and forth between your team and the verification firm, which in turn will cut down the time it takes to complete your firm’s verification process.
If you have any questions about GIPS verification and the role Orion plays in supporting your firm, please contact the Orion SME Performance Team at performance@orion.flywheelsites.com.
0258-OAS-7/12/2017
Common Performance questions: What to do when your Blended Benchmark calculations don’t add upWelcome to our series on Common Performance Questions. In today’s feature Joe Porter, Orion’s Product Manager of Composites and Performance, will detail some of the reasons why it might appear that your blended benchmark performance in Orion doesn’t match your manual calculation.
Think back to the days of high school (or college) algebra. Remember when you plugged all the variables into the equation only to arrive at a different answer than your classmate? We’ve all experienced the frustration and unease that comes when something doesn’t quite match up. You’re often left thinking “what did I do wrong?”

If your Blended Benchmark performance in Orion doesn’t match up with your manual calculation, there are a couple things that could be causing the difference.
Index Total Return or Index Price Return
One of the most common reasons for differences is that the benchmark is using the index total return (TR), whereas the selected index the user has chosen for the manual calculation is the index price return (PR). The difference between TR and PR is that TR reinvests the dividends and PR does not reinvest the dividends.
The 2016 return for the S&P 500 TR was +11.96% whereas the 2016 return for the S&P 500 PR was +9.54%. As you can see the performance numbers are quite different, which in turn will cause a difference in the return of the blended benchmark in Orion and the manual calculation.
The Blended Benchmark’s Rebalance Interval
Another reason there could be differences in calculations could be due to how often the blended benchmark is set up to rebalance (this is called the “rebalance interval”). The available rebalance interval options are daily, monthly, quarterly, semi-annually, annually, and buy and hold. The rebalance interval determines how often the individual indexes in the blend are set back to their target weights.
If the rebalance interval is set to daily, then the calculation will use the target’s weights each day when calculating performance. The other interval options allow for a “drift” to occur. The weights of the individual indexes will change based on how they perform, as well as the other indexes in the blend. For example, with a blend of 50% S&P 500 and 50% MSCI ACWI Ex USA it is possible for the S&P to outperform causing the weights to be more like 52%/48%.
Show Your Work
Let’s look at some examples on how using TR vs PR and different rebalance frequencies can affect the overall blended benchmark performance for the year 2016.
The two charts below are set to rebalance daily for the following blended benchmarks: a blended benchmark with 50% S&P 500 PR / 50% MSCI ACWI Ex USA and a blend of 50% S&P 500 TR / 50% MSCI ACWI Ex USA. To calculate the blended benchmark performance, we are going to take the index weight of 50% for each index and multiply that by the 2016 performance for each individual index. We will then sum up each index contribution to get the blended benchmark’s performance for 2016.

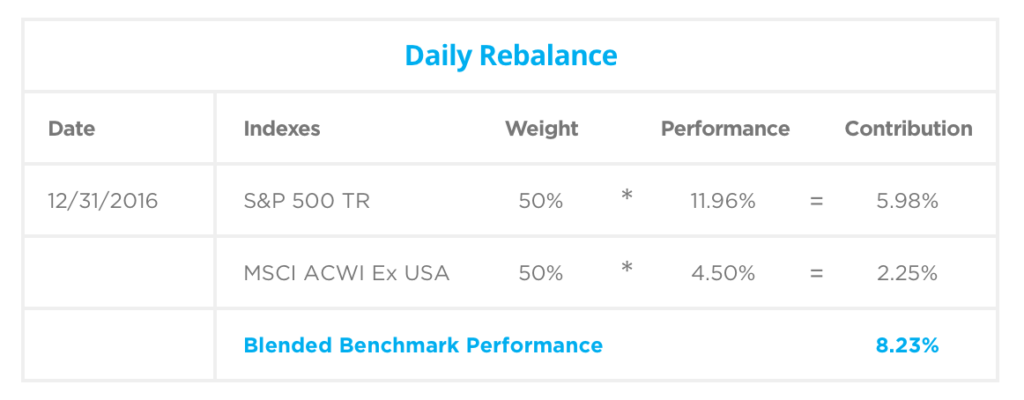 There is a difference of 1.21% (8.23% – 7.02%) between the blend that uses TR and the blend that uses PR for 2016.
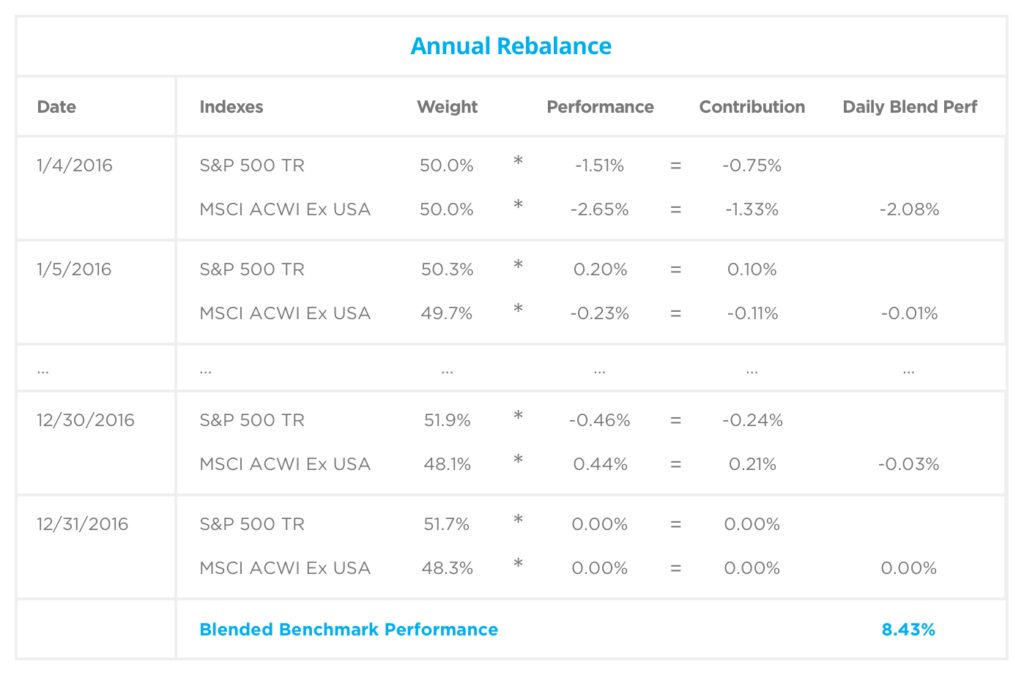
The two charts we will look at next have the rebalance interval set to annually for a blended benchmark with 50% S&P 500 PR / 50% MSCI ACWI Ex USA and a blend of 50% S&P 500 TR / 50% MSCI ACWI Ex USA. As we can see from the charts below, each day the weight of the blend will change (drift) due to how each index performs.
The weight of each individual index is then multiplied by that day’s performance and then summed together to get that day’s performance. All of the days in the time period are then summed together to get the overall blended benchmark’s performance.
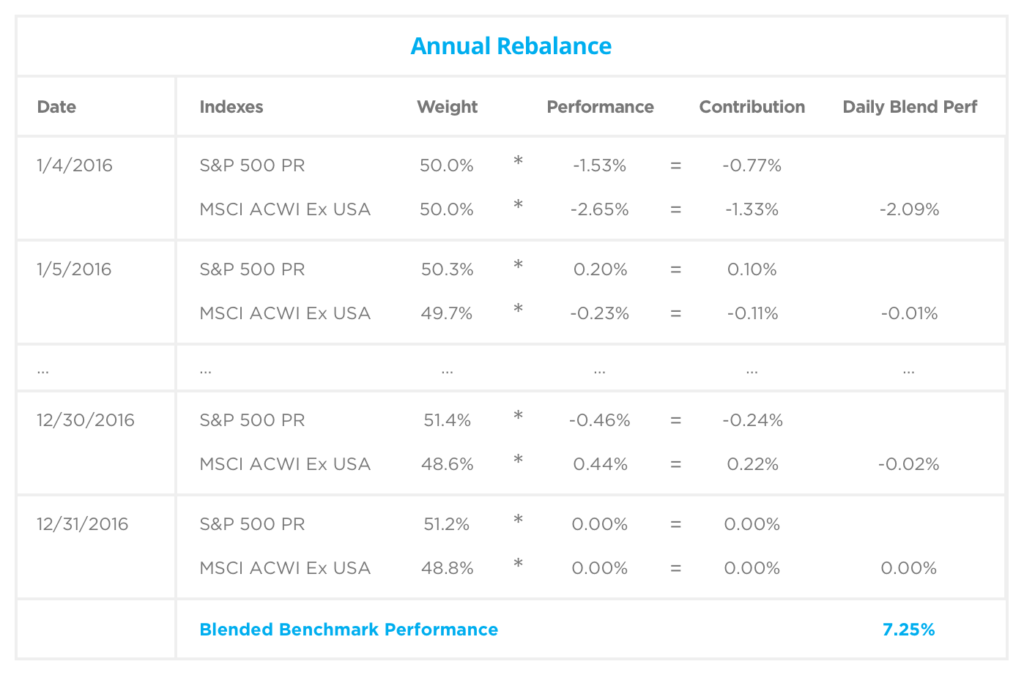
 * Start date of 1/4/16 was used, because that was the first day the market was open in 2016
There is a difference of 1.18% (8.43% – 7.25%) between the blend that uses TR and the blend that uses PR for 2016.
There is also a difference for the blends that do use the same index, but have different rebalance frequencies. The blend with the PR daily rebalance had a return of 7.02% vs the blend with the PR annual rebalance which had a return of 7.25%. The same for the blend with TR daily. It had a return of 8.23% vs the TR annual rebalance that had a return of 8.43%.
A good rule of thumb for choosing how often to rebalance a blend is to look and see how often you rebalance portfolios, because as we can see the type of index and the frequency that the blend is rebalanced to target weights will play into the overall performance of the blend.
If you have any questions about blended benchmarks or your Orion reports, please contact the SME Performance Team.
0226-OAS-6/8/2017